Session Analysis
Session Overview
At first tab on the riding session you want to analyse.
The session view consists of multiple parts, that are displayed depending on what's included in your session.
From top to bottom
- Lap Times Chart
- Session Summary
- Segment Analysis (GPS data required)
- Heartrate Analysis (heartrate data required)
- Lap Times List
Analyze GPS Data
Select Open GPS Analytics at the very top.
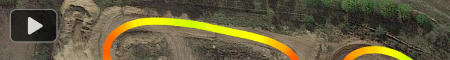
You'll now see one of your laps on a map. The colors of your lines are color-coded speeds. High speed values are colored green. Lower speed values will change from yellow towards red.
To start the analysis, select a lap in the list below and press the playback button to enter full screen playback mode.
The display options toolbar will then animate in.
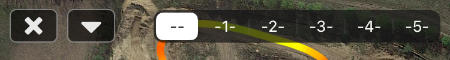
The numbers to the right represent a filter for the available track segments. Select a number and your riding data will be limited to the selected segment.
The little triangle on the left side opens the display options menu. You can toggle the color-coding from Speeds to Mono and decide, whether you want to use the speed values included in your data or speed values calculated by MX Buddy.
The playback toolbar is located at the bottom of the map.
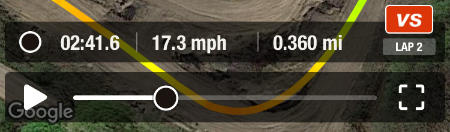
Use the playback controls to start or pause the real time playback. If you want the view to automatically follow the current position, press the button on the right side of the timeline.
Timeline navigation can be fiddly on smaller screens, especially when navigating longer laps. It can be really hard to fine tune to a specific location on the map.
But with the new MX Buddy timeline, you can effortlessly navigate as precisely as you want. If you need higher precision, move your finger up while dragging the knob left or right. The further away your finger from the knob, the higher the navigation precision.
Compare Laps
To compare the currently selected lap with another one, press the VS button and select either a lap of the same session or a lap of another session with the same track configuration.
After you selected anither lap, you control the playback of both laps simultaneously. If you want to compare the laps on specific track segments, just use the segment filter at the top.
But what if you need to compare sections that are different from your preconfigured track segments?
MX Buddy has a really ingenious solution for this! This is how it works:
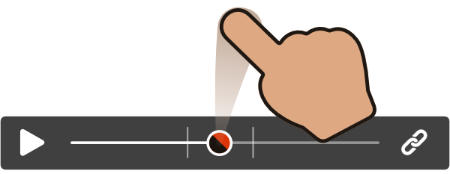
1. Unlink Laps - Unlink the laps by pressing the link button.

2. Align Laps - Move the red dot on the slider (compare lap position) until the compare position matches the main position on the map.

3. Link Laps - Tap the link button to link the laps again.

That's it. Now you can play back both laps from the same position and find out which line is the fastest.
How to find fastest lines

There's an article on how to systematically break down a track and find lines that work and those who don't.
Here's the link on mxbuddyapp.com
It's a good read! Promised! ☝️